$ python tracker.py
Denver Broncos at San Francisco 49ers · Levi's Stadium, Santa Clara CA · 2026-10-04

day          sales   sale median     get-in
2026-09-22      30       $315.06    $168.31
2026-09-23      29       $273.78    $168.70
2026-09-24      25       $264.32    $154.51
2026-09-25      36       $272.13    $148.43
2026-09-26      35       $301.59    $148.21
2026-09-27      53       $303.00    $138.64
2026-09-28      69       $272.16    $138.30

saved 31 rows to prices.csv
Resale ticket prices move every day. A tracker records that movement, so you can see where a market is going and not only where it is now. This tutorial builds one in Python with the SeatData API and its SDK.
The tracker works from observed sales. A listing shows an asking price, and an asking price can sit unsold for weeks. A sale record shows a listing that sold, with its listing price when the sale was observed. The finished script finds an event, pulls its sales, adds the get-in price history, and writes one row per day to a CSV file. It makes HTTPS requests through the SDK, so there is no page to scrape and no parser to maintain.
Each row of the CSV file holds four values:
day: the UTC date.sales: the number of sales observed on that day.sale_median: the median price of those sales.get_in: the get-in price from the day's last snapshot.
What you need
- Python 3.8 or newer.
- A SeatData API key. New accounts start with a $10 credit, and no card is needed to start. Create an account, then generate a key in the dashboard. The key is shown once, so store it when you see it.
- The SDK, version 1.1.0 or newer. The getting started guide has the setup steps in detail.
$ pip install "seatdata-sdk>=1.1.0"
$ export SEATDATA_API_KEY="your-64-character-key"
Every script below reads the key from the SEATDATA_API_KEY environment variable. Keep the key out of your source files and out of version control.
Step 1Find the event
Every sales call needs an event id. Search by name, city, and month to get one. The name can be a team or a performer.
import os

from seatdata import SeatDataClient

client = SeatDataClient(api_key=os.environ["SEATDATA_API_KEY"])

events = client.search_events(
    event_name="San Francisco 49ers",
    venue_city="Santa Clara",
    event_date="2026-10",
    historical=True,  # keeps the search working after the event date
    limit=5,
)
for event in events:
print(event["event_id"], event["event_date"], event["event_name"], "|", event["venue_name"])1256795 2026-10-04 Denver Broncos at San Francisco 49ers | Levi's Stadium
1326872 2026-10-19 Washington Commanders at San Francisco 49ers | Levi's StadiumEach result carries the event_id, the event date, and the venue. A team plays many home games in one season, so check the date before you copy the id. Each result also carries first_seen_date and days_on_seatdata, which tell you how much history exists for the event.
The date filter matches a part of the date, so 2026-10 finds every home game in October 2026. Search also accepts a venue name, a state, and a country code. The search reference lists every filter.
Step 2Pull the sales
The sales endpoint returns every observed sale for the event, newest first. A page holds 100 rows by default and 200 at most. The SDK iterator follows the cursor for you, so one loop walks the full history.
import json
import os
import sys

from seatdata import SeatDataClient

EVENT_ID = 1256795  # the event_id from step 1

client = SeatDataClient(api_key=os.environ["SEATDATA_API_KEY"])

sales = client.iter_event_sales(event_id=EVENT_ID, source="all")
rows = list(sales)
if not rows:
    sys.exit("This event has no observed sales yet.")

# total_count arrives on the first page only
print(len(rows), "rows of", sales.first_page["total_count"])
print(json.dumps(rows[0], indent=2))1516 rows of 1516
{
  "timestamp": 1790630377,
  "quantity": 8,
  "price": 765.0,
  "zone": "",
  "section": "Section P244",
  "row": "1",
  "source": "vs",
  "all_in_price": 1058.0,
  "listing_id": "VB16627651015",
  "norm_zone": "200-Level",
  "norm_section": "244"
}source="all" merges the sources that SeatData tracks for the event. Without it, the call returns rows from the sh source only. The total count arrives on the first page, so the iterator exposes it as first_page["total_count"].
Rows are plain dictionaries. The SDK also ships type definitions for them, so an editor can complete the field names as you type.
Step 3Read a sale record
Each row is one observed sale. Two fields need care before you do any math with them.
{
"timestamp": 1790630377,
"quantity": 8,
"price": 765.0,
"zone": "",
"section": "Section P244",
"row": "1",
"source": "vs",
"all_in_price": 1058.0,
"listing_id": "VB16627651015",
"norm_zone": "200-Level",
"norm_section": "244"
}- timestampinteger, unix seconds
- When the sale was observed, in UTC.
- quantityinteger
- Tickets sold. Quantity is inferred from observable marketplace changes.
0means it could not be reliably determined. - pricenumber
- Price reflects the listing price at time of observation. The figure is per ticket and before fees.
- zone, section, rowstring
- The seat location as listed.
- norm_zone, norm_sectionstring, vs rows only
- The zone and the section under the names that the
shsource uses. - listing_idinteger or string
- The listing that the sale came from. An integer on
shrows, a string onvsrows. - source"sh" | "vs"
- The source that observed the sale.
- all_in_pricenumber or null
- The fee-inclusive price, when the source shows one. Always
nullonshrows.
Step 4Compute the daily price
A single sale is a weak signal. A day of sales is a better one. Group the rows by day and take the median of each group. The median is the middle value of the group. The standard library computes it, so the tracker does not need pandas.
import os
import statistics
from collections import defaultdict
from datetime import datetime, timezone

from seatdata import SeatDataClient

EVENT_ID = 1256795


def medians(rows, key):
    """Return {group: (sale count, median price)}, with the groups in sorted order."""
    groups = defaultdict(list)
    for row in rows:
        groups[key(row)].append(row["price"])
    return {name: (len(prices), statistics.median(prices)) for name, prices in sorted(groups.items())}


def day_of(row):
    return datetime.fromtimestamp(row["timestamp"], tz=timezone.utc).date().isoformat()


def zone_of(row):
    return row.get("norm_zone") or row["zone"] or "(no zone)"


client = SeatDataClient(api_key=os.environ["SEATDATA_API_KEY"])
rows = list(client.iter_event_sales(event_id=EVENT_ID, source="all"))

print("by day")
for day, (count, median) in list(medians(rows, day_of).items())[-5:]:
    print(f"  {day}  {count:>4}  ${median:,.2f}")

print("by zone")
for zone, (count, median) in medians(rows, zone_of).items():
print(f" {zone:<24}{count:>4} ${median:,.2f}")by day
2026-09-24 25 $264.32
2026-09-25 36 $272.13
2026-09-26 35 $301.59
2026-09-27 53 $303.00
2026-09-28 69 $272.16
by zone
(no zone) 2 $396.50
100-Level 598 $342.16
100-Level Club 71 $764.10
200-Level 291 $274.00
200-Level Club 39 $607.30
300-Level 185 $242.37
400-Level 329 $178.08
Standing Room Only 1 $302.84The script groups by UTC day. If you need local days, convert each timestamp to the time zone of the venue first.
The same grouping works per zone. Rows from the vs source carry a norm_zone field. It holds the name that the sh source uses for those seats. The script groups on norm_zone when the field is present, so the two sources line up. A few rows have no zone, and the script groups them under (no zone).
Step 5Add price history
Sales show what sold. The stats endpoint shows what was on offer. Each snapshot holds the get-in price, which is the lowest active listing price, and the median listing price. Each snapshot also breaks both figures out by zone.
import os
from datetime import date, timedelta

from seatdata import SeatDataClient

EVENT_ID = 1256795
EVENT_DATE = "2026-10-04"

client = SeatDataClient(api_key=os.environ["SEATDATA_API_KEY"])

# the window ends today, or on the event date when the event is over
last = min(date.today(), date.fromisoformat(EVENT_DATE))
start = (last - timedelta(days=30)).isoformat()
get_in = {}
for snap in client.iter_event_stats(EVENT_ID, start_date=start):
    # newest first, so the first snapshot seen for a day is that day's last reading
    get_in.setdefault(snap["timestamp"][:10], snap["get_in"])

for day in sorted(get_in)[-5:]:
print(day, f"${get_in[day]:,.2f}")2026-09-24 $154.51
2026-09-25 $148.43
2026-09-26 $148.21
2026-09-27 $138.64
2026-09-28 $138.30Snapshots arrive newest first. The script keeps the first snapshot it sees for each day, which is that day's last reading. The start_date filter limits the walk. The start is 30 days before today, or 30 days before the event date when the event is over.
Step 6Save and schedule
The full script joins the two series on the day. It writes one row per day to prices.csv and prints the last seven days. Each run rewrites the file. The file goes back 30 days from today, so it never grows without limit. For a past event, it goes back 30 days from the event date.
For an upcoming event, schedule the script once a day with cron. Put the key in a file that only your user can read, and load that file in the cron line.
# tracker.env holds one line:  export SEATDATA_API_KEY="your-64-character-key"
# chmod 600 tracker.env
15 6 * * * cd /home/you/tracker && . ./tracker.env && python3 tracker.py >> tracker.log 2>&1
The SDK retries a failed request up to three times. When a request still fails, the SDK raises a SeatDataError, and the tracker exits with the message. Cron then writes that message to the log file.
Step 7Plot it
This step is optional and needs matplotlib. The script reads prices.csv and draws both series.
import csv

import matplotlib

matplotlib.use("Agg")
import matplotlib.pyplot as plt  # noqa: E402

days, medians, floors = [], [], []
with open("prices.csv", newline="") as handle:
    for row in csv.DictReader(handle):
        days.append(row["day"][5:])
        medians.append(float(row["sale_median"]) if row["sale_median"] else float("nan"))
        floors.append(float(row["get_in"]) if row["get_in"] else float("nan"))

fig, ax = plt.subplots(figsize=(10, 5), dpi=120)
ax.plot(days, medians, color="#3DA4DF", linewidth=2.5, marker="o", label="Median sale price")
ax.plot(days, floors, color="#EC5D50", linewidth=2.5, marker="o", label="Get-in price")
ax.set_ylabel("Price (USD)")
ax.yaxis.set_major_formatter("${x:,.0f}")
ax.grid(axis="y", alpha=0.25)
ax.spines[["top", "right"]].set_visible(False)
ax.legend(frameon=False)
fig.autofmt_xdate()
fig.tight_layout()
fig.savefig("chart.png")
print("saved chart.png")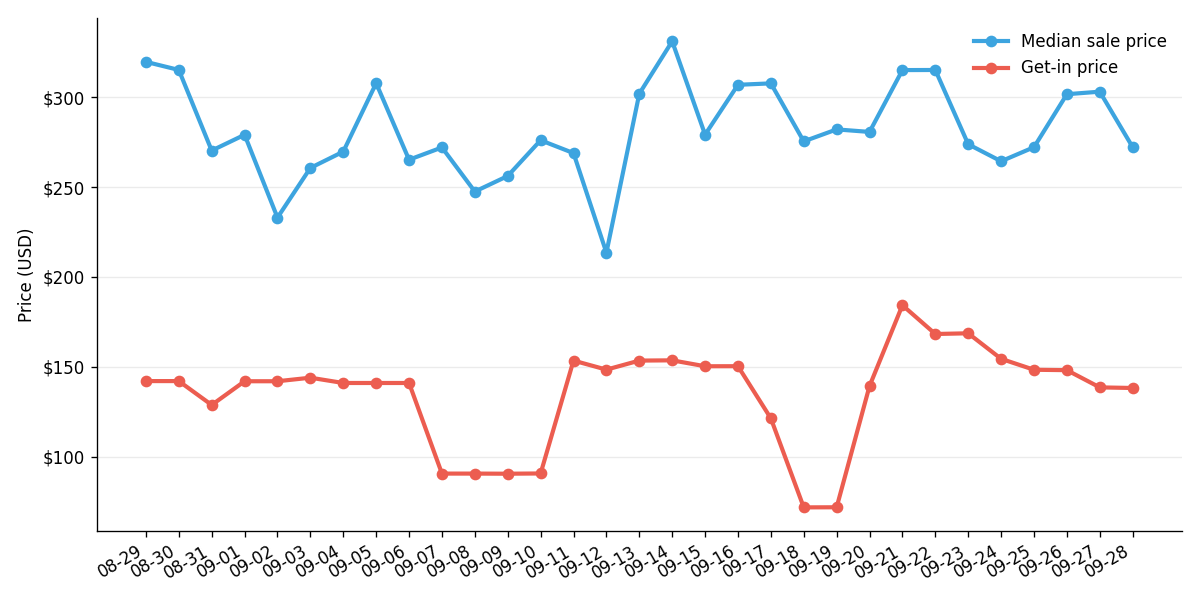
05_plot.py, captured September 28, 2026.Read the numbers
The two lines answer different questions. The get-in price is the lowest active listing on a day. The median sale price is the middle of the listings that sold on that day. Three checks keep you from reading too much into a chart.
- Check the count. A median of three sales moves far more than a median of sixty. The
salescolumn tells you which one you have. - Check the mix. The daily median can rise because better seats sold that day, not because prices rose. Compare within one zone to separate the two effects.
- Check the gap. The get-in price describes the cheapest seats only. It can fall while the median sale price holds, and the reverse.
The example chart shows why the third check matters. In the middle of September, the get-in price fell by about half within two days. Three days later, it stood above its earlier level. The median sale price moved far less in the same days. The get-in price follows the cheapest listing of the day, so a single listing can move it. Read it together with the median sale price.
What a run costs
One run of the tracker makes three kinds of call.
| Call | SDK method | Cost |
|---|---|---|
| Search | search_events | Free |
| Sales | iter_event_sales | 1 pull per event. Paging is free. |
| Stats | iter_event_stats | 1 pull per event. Free when nothing new has been recorded. |
A daily run for one event costs 2 pulls at most. The usage endpoint reports your totals for the billing period. It is free, so a script can check it after every run.
import os

from seatdata import SeatDataClient

client = SeatDataClient(api_key=os.environ["SEATDATA_API_KEY"])

usage = client.get_usage()
totals = usage["totals"]
print(usage["period_start"], "to", usage["period_end"])
print("searches:   ", totals["events_searched"])
print("sales pulls:", totals["salesdata_pulls"])
print("stats pulls:", totals["stats_pulls"])
The price of a pull depends on your plan. See API pricing for the current rates.
Full script
The complete tracker in one file. The panel scrolls, and the copy button takes all of it. To track a different event, change PERFORMER, CITY, and EVENT_DATE at the top. After the example game, the script goes back 30 days from the date of the game.
"""Track resale ticket prices for one event with the SeatData API.

Usage:
    export SEATDATA_API_KEY="your-64-character-key"
    python tracker.py
"""
import csv
import os
import statistics
import sys
from collections import defaultdict
from datetime import date, datetime, timedelta, timezone

from seatdata import SeatDataClient, SeatDataError

PERFORMER = "San Francisco 49ers"
CITY = "Santa Clara"
EVENT_DATE = "2026-10-04"  # the team plays several home games, and the date selects one
DAYS = 30  # how far back the CSV file goes
SHOW = 7  # how many days to print
CSV_PATH = "prices.csv"


def find_event(client):
    # historical=True keeps the search working after the event date
    events = client.search_events(
        event_name=PERFORMER, venue_city=CITY, event_date=EVENT_DATE, historical=True, limit=1
    )
    if not events:
        sys.exit("No event found. Check PERFORMER, CITY, and EVENT_DATE.")
    return events[0]


def first_day(event_date):
    """Return the first day of the window. The window ends today, or on the date of a past event."""
    last = min(date.today(), date.fromisoformat(event_date))
    return (last - timedelta(days=DAYS)).isoformat()


def sale_medians(client, event_id):
    """Return {day: (sale count, median price)} from the observed sales."""
    by_day = defaultdict(list)
    for row in client.iter_event_sales(event_id=event_id, source="all"):
        day = datetime.fromtimestamp(row["timestamp"], tz=timezone.utc).date().isoformat()
        by_day[day].append(row["price"])
    return {
        day: (len(prices), round(statistics.median(prices), 2))
        for day, prices in by_day.items()
    }


def get_in_prices(client, event_id, start):
    """Return {day: get-in price}. Snapshots arrive newest first, so keep the first per day."""
    get_in = {}
    for snap in client.iter_event_stats(event_id, start_date=start):
        get_in.setdefault(snap["timestamp"][:10], snap["get_in"])
    return get_in


def money(value):
    return "-" if value is None else f"${value:,.2f}"


def main():
    api_key = os.environ.get("SEATDATA_API_KEY")
    if not api_key:
        sys.exit("Set the SEATDATA_API_KEY environment variable first.")
    try:
        client = SeatDataClient(api_key=api_key)
        event = find_event(client)
        start = first_day(event["event_date"])
        medians = sale_medians(client, event["event_id"])
        get_in = get_in_prices(client, event["event_id"], start)
    except (SeatDataError, ValueError) as error:
        sys.exit(f"SeatData error: {error}")

    days = sorted(day for day in set(medians) | set(get_in) if day >= start)
    if not days:
        sys.exit(f"No sales or price history since {start}.")

    with open(CSV_PATH, "w", newline="") as handle:
        writer = csv.writer(handle)
        writer.writerow(["day", "sales", "sale_median", "get_in"])
        for day in days:
            count, median = medians.get(day, (0, None))
            writer.writerow([day, count, median, get_in.get(day)])

    venue = f'{event["venue_name"]}, {event["venue_city"]} {event["venue_state"]}'
    print(f'{event["event_name"]} · {venue} · {event["event_date"]}')
    print()
    print(f'{"day":<12}{"sales":>6}{"sale median":>14}{"get-in":>11}')
    for day in days[-SHOW:]:
        count, median = medians.get(day, (0, None))
        print(f"{day:<12}{count:>6}{money(median):>14}{money(get_in.get(day)):>11}")
    print()
    print(f"saved {len(days)} rows to {CSV_PATH}")


if __name__ == "__main__":
    main()
Troubleshooting
- ValueErroron start
- The key is not 64 characters long. Copy it again from the dashboard.
- SeatDataAuthErrorHTTP 401
- The key is wrong or was revoked. Generate a new key.
- SeatDataPaymentErrorHTTP 402
- The balance does not cover the pull. Add funds or choose a plan.
- SeatDataRateLimitErrorHTTP 429
- Too many requests. The error carries
retry_after, the number of seconds to wait. - No event foundtracker message
- The search matched nothing. Check the spelling of
PERFORMERandCITY, and the date inEVENT_DATE. - No sales or price historytracker message
- The event has no data since the start date. Raise
DAYS, or select an event with more history.
Next steps
The tracker follows one event. The same calls scale to a watchlist: the batch endpoint takes up to 100 events in one request, and the async client runs the calls side by side.
- POST /v1/events/sales/batchTrack a watchlistPull up to 100 events in one request.
- AsyncSeatDataClientGo asyncThe same methods, for concurrent jobs.
- Ticket Data APISee every endpointSales, price history, listings, and search.
FAQ
Is there an API for ticket resale prices?
Do I need to scrape anything?
How much does one run cost?
What does a quantity of 0 mean?
Can I track an event that has already happened?
historical=True to include past events, as the scripts in this tutorial do.